How Regen Bazaar Prices Impact: Methodology v0.1 to v0.2
What was taken out of the Impact Value, why every weight now has a public card with its source status, and how a price is built from impact with declared costs allowed to raise it by 50% at most.
What was taken out of the score, what every weight has to show, and why costs raise a price by at most half
One planting, two reports
Picture a mangrove planting on a Thai coast. The group that did it writes one report saying "3,000 mangroves planted". A second group writes "1.5 hectares of mangroves restored". If both plantings are the same size, both should get the same score. In the first version of Regen Bazaar's Impact Value, they did not. The formula took raw counts in whatever unit the report used, so the score depended partly on how the work was written down.
Regen Bazaar is a marketplace where creators (organisations, informal groups or single people) sell environmental and social work they have already done. A report goes in as plain text, a validator checks the proof, and the verified work is listed as editions that anyone can buy. Each report gets an Impact Value (IV), Regen Bazaar's own relative index of impact, and the IV sets the price.
That number is the subject here. Methodology v0.2, live since 28 September 2026, was written so that the score changes only when the work changes. Below: what was taken out, what the score looks like now, how a price is built from it, and what is still weak. The extraction test and the purchase mechanics are in the first piece.
What v0.1 let the wording do
Version 0.1 multiplied each action's weight by several factors, and three of them rewarded things other than impact. A time bonus (TBV, 1 plus 0.1 per year) made a longer reporting period score higher, though a longer period is not more impact. A population-density factor (PIM, 1.0 to 1.8) raised the score for crowded places, though the number of people reached is already counted directly. A complexity factor (ACDM, 1.0 to 1.42) raised the score for work that was harder to do. A size factor (SM, 1.0 to 2.0) was applied line by line, and the regional sensitivity factor (ESM, up to 1.5) was picked by the creator from a list.
The 34 weights themselves were seed numbers without a record of where they came from.
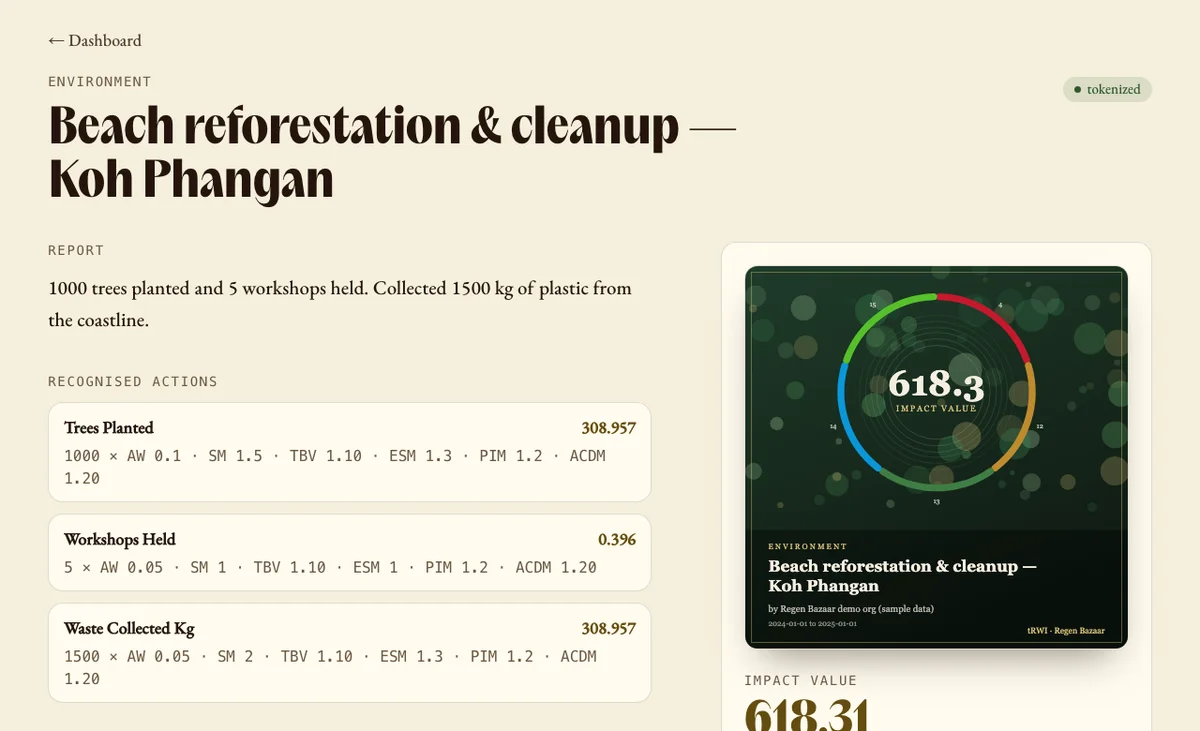
A v0.1 report (test data). Every action carries SM, TBV, ESM, PIM and ACDM on top of its weight.
The changelog in the repository lists what changed and why. The rule behind the changes: every input a creator types should either be a fact about the work or be checked by someone else.
Physical units first
In v0.2 every quantity is converted to a physical unit before it is weighted. Planted trees and mangroves become hectares per monitored year, from a declared area or a declared planting density. Tonnes, grams and pounds become kilograms. Square metres, acres and rai become hectares (one rai is 0.16 ha). Litres of drinking water become person-days at 5.5 litres per adult per day. Kilowatt-hours of solar or wind become tonnes of CO₂e through the country's grid factor.
Back to the two reports. If the first one states a planting density, say 2,000 mangroves per hectare, then 3,000 mangroves and 1.5 hectares are the same quantity and score the same. If it states only a count, the carbon part scores nothing and the validator is told why. A unit the engine cannot convert, such as "bags" for waste, scores zero and raises a flag.
The screens now lead with the physical result. A mangrove report shows a line in the form "20.0 tCO₂e/yr, 1.2 ha of mangroves" before the single index number.
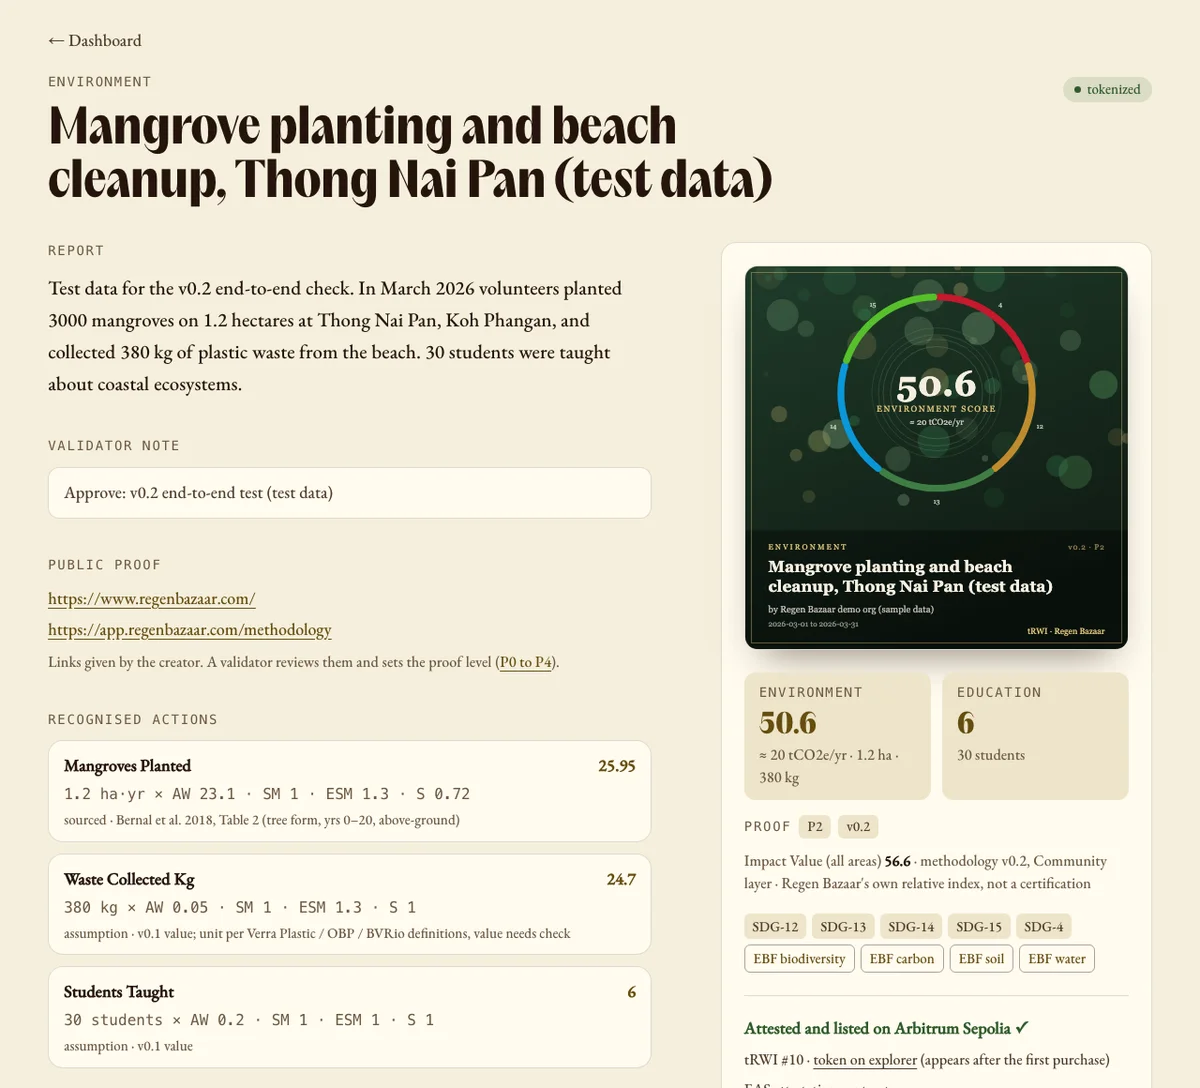
A v0.2 report (test data): each action with its weight, area factor, sensitivity and survival, and the physical result beside the Impact Value.
A card for every weight
Each action has a weight per physical unit, and each weight has a public card: the definition and unit, what the number represents, the anchor in a published source, the arithmetic, a sensitivity test and a list of open questions for experts. Environment weights are counted in tonnes of CO₂e-equivalent, one point per tonne.
The mangrove card shows how this reads. The weight is 23.1 per hectare per year, from Table 2 of Bernal, Murray and Pearson (2018), a figure for planted tropical mangroves in tree form. It is multiplied by a survival factor, 0.72 by default, a proxy from Bourgeois and co-authors (2024), and replaced by the measured surviving share when the group has one. The card says the survival default is an assumption that needs checking.
Every card carries one of three source statuses: sourced (a cited table), derived (our arithmetic on a cited table), or assumption. Of the 34 actions, 22 are scored in the Community layer, the part of the methodology built for work volunteers can do. Two of those weights are sourced (one is the zero for volunteers), three are derived and 17 are assumptions: platform judgement that still waits for expert review. The methodology page says so in its first paragraph, and the card list shows the status next to every number.
To see how much the assumptions matter, the repository includes a sensitivity test: each weight moved by 50% up and down against 13 illustrative reports, counting how many change rank. These are sample reports, not pilot data. Shifting the mangrove weight down by half moves five of the thirteen. The test marks that weight as unstable.
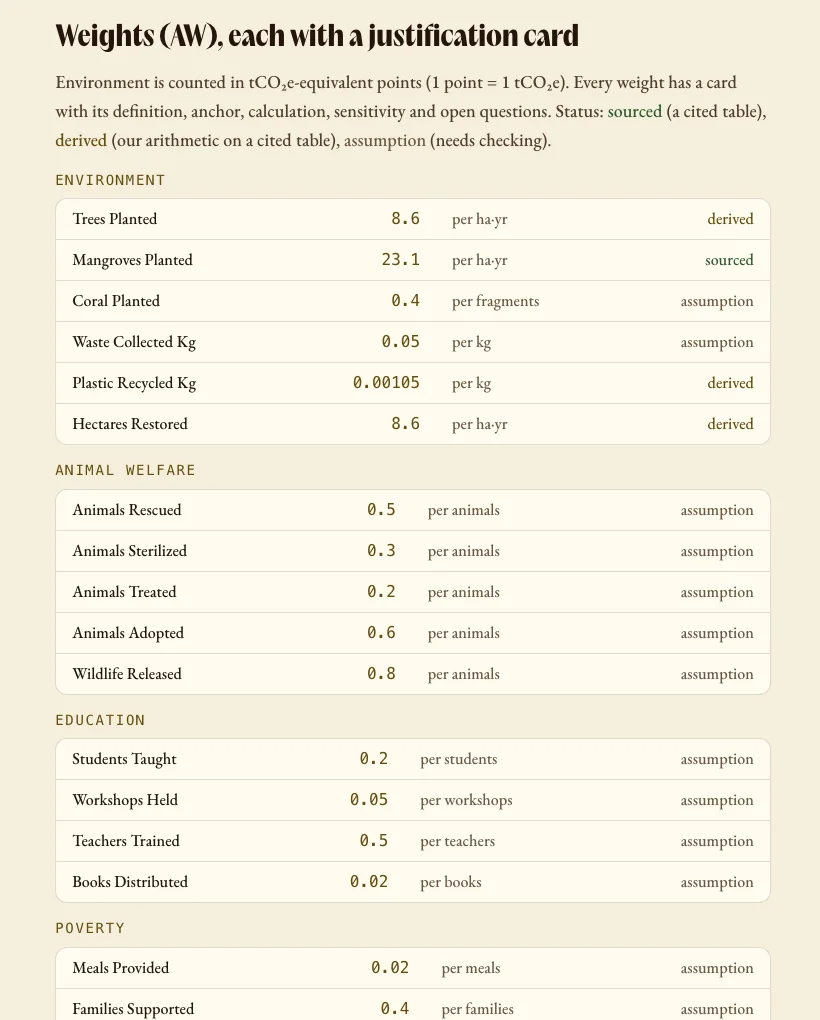
The weights table on the methodology page. The status of every number is on the right.
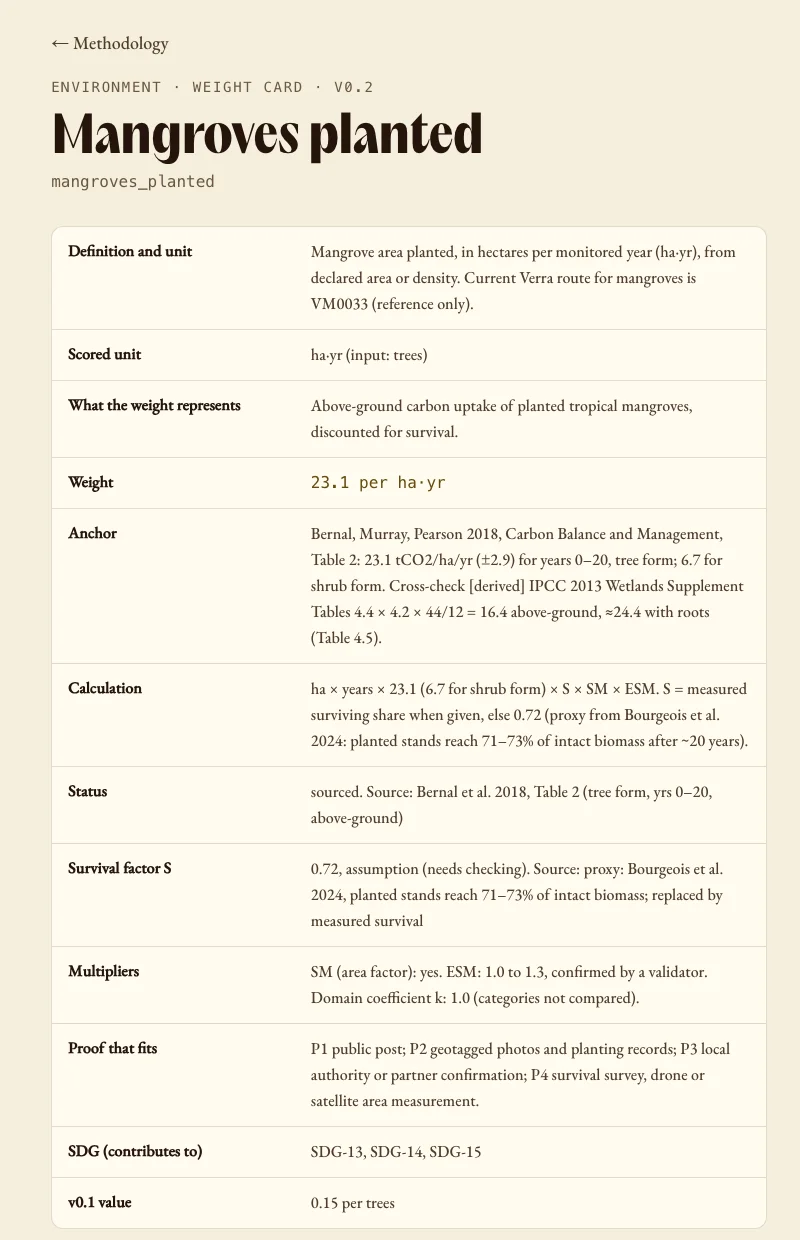
The mangrove weight card. The last row keeps the v0.1 value.
The same work counts once
Several rules apply inside a single report. Lines for the same action are added up before scoring, so how a report is divided into lines cannot change the result. When a planting gives both an area and a tree count, the area counts and the count is evidence. Work already registered with a carbon standard, with a declared serial number, scores no carbon here. Recycled plastic adds only its carbon benefit when collection is also reported. Workshops score zero when their participants are counted, and meals and family support for the same families count once, whichever is higher. Volunteers are an input, they score zero and appear as context. One merged action is capped at a million input units, and carbon is credited for at most 20 monitored years.
Twelve other actions that need capital, a licence or professionals (registry carbon, solar, water systems, construction, housing, scholarships, microloans, jobs, medical treatment, vaccination, therapy) stay in the tables and score zero for now.
Where the removed factors went
The time bonus and the density factor are gone. Carbon is credited per monitored year, which captures duration where it belongs, and reach is counted as people, students or patients. The size factor changed direction. Large lines used to earn a bonus of up to double. Now a small isolated patch under half a hectare gets 0.75, from half a hectare 0.9, and a full hectare or a site joining existing habitat gets 1.0 (Haddad and co-authors, 2015, on habitat fragmentation). Regional sensitivity now runs from 1.0 to 1.3. A validator checks the site's coordinates on open maps and sets it; until then it stays 1.0. Complexity left the score and moved to the price, because difficulty is a cost.
Each category is scored in its own physical units. The platform does not compare environment with education or animal welfare, and v0.2 makes no attempt to.
Price: impact first, costs as a coefficient
The price in US dollars is
IV × rate × P × E, split across the editions (a report is divided into 100 today).
The Impact Value sets it. The rate is one dollar per point for now. P is the proof factor from the level a validator assigns: 0.6 for one matching public link, 0.8 for dated photos or two independent traces, 0.9 for a second party's confirmation, 1.0 for third-party measurement or a registry record. P0, text only, is not listed at all.
E is where the cost of the work enters, and it can do very little by design. The group may put its effort on record: volunteer hours, the value it assigns to one hour, and money spent on materials, transport, equipment, food and paid services. The declared cost is converted to dollars and compared with the base price of the impact, IV times the rate:
E = 1 + 0.5 × min(1, declared cost ÷ (IV × rate)).
So E runs from 1.0, with no declared cost, to 1.5. Costs raise the price by at most half. They are never added as dollars, and they never replace the impact: at the same cost, more impact gives a higher price.
A worked example, with illustrative figures. The 1.2-hectare mangrove report scores 25.95 points: 1.2 ha × 23.1 × 0.72 survival × 1.3 sensitivity, for one monitored year. At proof level P2 the price is 25.95 × $1 × 0.8 = $20.76. If the group declares $13 of work (half the base price), E is 1.25 and the price is $25.96. A group that declares $100 hits the ceiling, E = 1.5, and the price is $31.14. The hundred dollars of cost did not buy a hundred dollars of price.
A person checks the declared hourly value. Next to it the validator sees the legal minimum wage per hour for that country, with a table covering ten countries from Thailand to the United States. It is a reference frame, not a limit. A declared hour worth far more than the minimum prompts a question; nothing is rejected automatically.
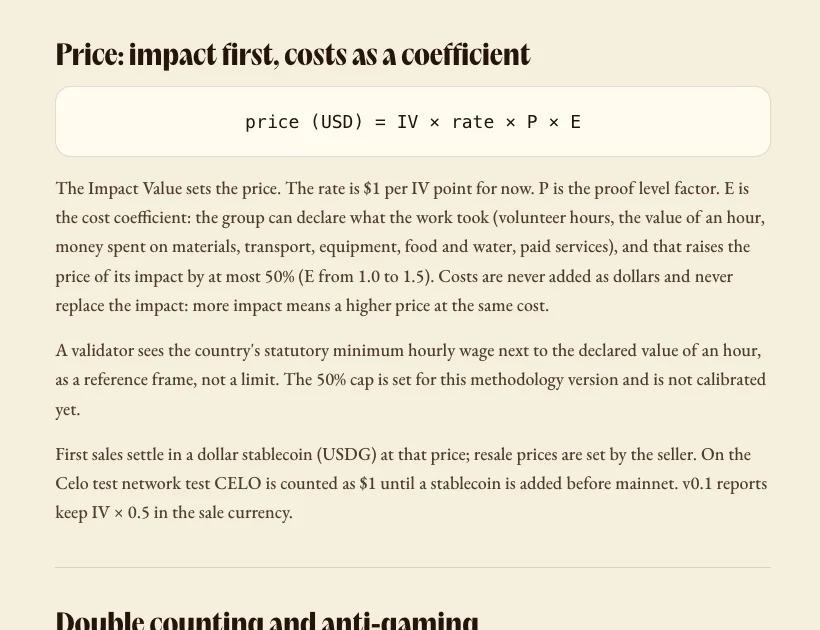
The price section of the methodology page.
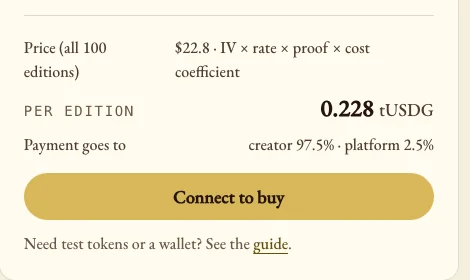
A test listing: $22.8 = 19 × $1 × 0.8 × 1.5, a test report that sits at the cost ceiling.
Three numbers in that model are provisional, and the methodology page says so: the rate of one dollar per point, the proof factors (a pilot hypothesis), and the 50% ceiling, which is set for this version and not calibrated.
Old reports keep their score
Every score is stamped with the methodology that produced it and is never rescored. Reports from before 28 September keep their v0.1 value, and their price stays at the v0.1 rule, IV × 0.5 in the sale currency. The two scales differ, so a v0.1 number and a v0.2 number should not be compared. In the weight cards, the old value sits in a field of its own, for example 0.15 per tree for mangroves against 23.1 per hectare-year now.
Why the creator cares
Regen Bazaar sells impact that has already happened. A buyer buys editions of a verified report, and the payment goes to the creator in the same transaction: 97.5% to the creator, 2.5% to the platform, or 95%, 2.5% and 2.5% when a partner organisation brought the impact. A creator can be an organisation, an informal group or one person.
That is why the price has to come from the work. The money arrives after the result and tells the creator that finished work sells. The creator can use it for the next piece of work, and that is how funding happens here: after the result, not before it. The buyer is buying, not donating, and can retire an edition in their own name if they want the impact to be theirs permanently.
What is still weak
Seventeen of twenty-two scored weights are assumptions. The rate, the proof factors and the cost ceiling are provisional. Environmental sensitivity is set by a validator checking open maps by hand, and an automatic lookup is only planned. All listings today are on test networks.
The cards list their open questions for experts: whether soil carbon should count for mangroves, whether the survival default is fair for unmonitored plantings, how to credit the first years after planting. If one of them is a field you know, the methodology is at https://app.regenbazaar.com/methodology, and the weight cards sit under it.
Need systems like this — or the clients to fill them?